Chapter 5 Automate Your Repetitive Report
Many analytic teams get bored. They can not handle interesting tasks because the teams is too busy to produce the daily updates and report they need for business. For example, some teams still use reporting tools likes Microsoft Excel. If any repetitive reports which still using this tool, it might be time-consuming to do the tasks that should not be too difficult. Other analytic tools that are widely applied for data visualization or making reporting purposes built on databases can cause expensive design and maintenance processes.
In many cases, there is an opportunity to reduce the burden substantially. By using open source tools to automatically process, visualize, and serve data to client with almost no human effort at all and of course no charge. You will learn how to automate report using R by combining R markdown and Shiny.
This is the syllabus for this course:
Reproducible function in R
- How do function help us with reproducibility?
- How to write function in R?
Introduction to Shiny
- Structure of basic shiny apps
- The advantages of shiny
Combining Shiny and R markdown
- Genereting downloadable reports
[Optional] Create Awesome table using
kableExtra
5.1 Reproducible function in R
A function is a set of statements that are compiled together to perform a specific task. R has a large number of built-in functions and users can create their own functions. In R, functions are objects so that the translator R can pass control to the function, along with arguments that might be needed for the function to complete the action.
How do function help us with reproducibility?
The benefit of writing function is to avoid repetation of your code. When you want to copy a piece of code five times and only change the variable in each instance, you better convert it to a function. In general, you should not repeat yourself when writing a code, it is called DRY (Don’t Repeat Yourself) principle.
5.1.1 How to write function in R?
The R function is an object that created with the keyword function. The basic command of an R function definition is as follows:
So the following are the differences of each component in the function:
- Function name: this is the actual name of the function which store in environment as an object. We just need to write the name of the function if we want to use it.
- Argument: When a function is called, we assign a value to the argument. Argument are optional; so the function may not contain an argument, also can have a defaults value.
- Function body: The function body contains a collection of statements that define what function does. We can define commands to process an input (arguments) here.
- Return value: The return value of function is the last expression or command in the body of the function to be evaluated. We also define explicitly with the
return(object_name)command that we want to return as an output value.
R has many in-built functions which can be directly called in the program without defining them first. We can also create and use our own functions referred as user defined functions.
5.1.1.1 Built-in Function
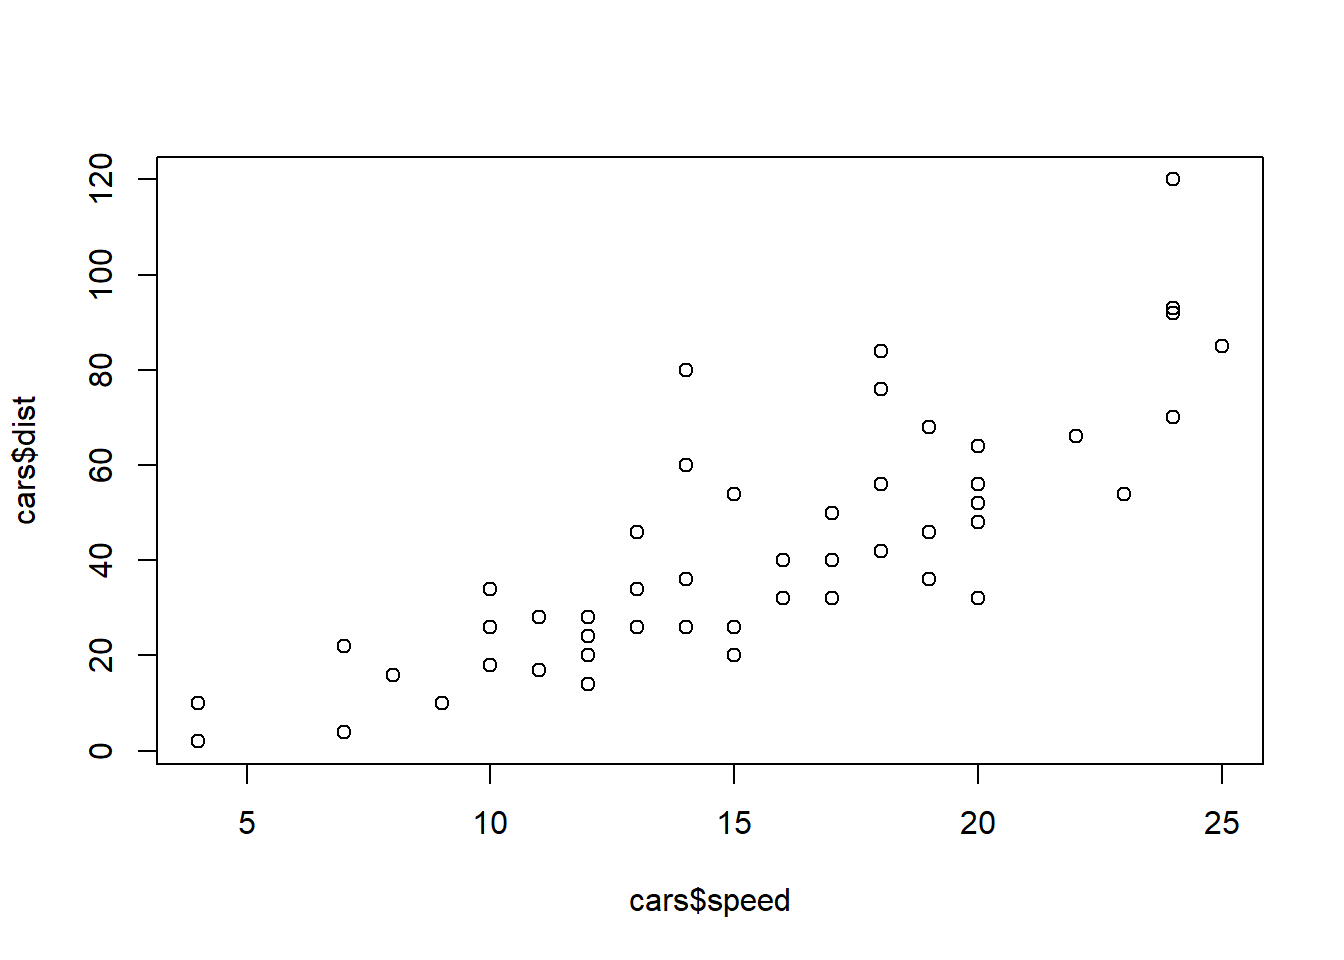
plot() is one of built-in function in R for plotting of R objects. For simple scatter plots, we just need to define axis x and axis y in the argument of plot() function.
5.1.1.2 User-defined function
Let’s say we want to develop new function to create the same as previous plot with an improvement aesthetics using ggplot2 packages. We will not discuss more about the functionality of the ggplot2 package, but if you want to learn by yourself please visit this page
scatter_plot <- function(data, xaxis, yaxis, title, sub){

  # define the library

  library(ggplot2)
  library(rlang)

  xaxis <- sym(xaxis)
  yaxis <- sym(yaxis)

  # visualization

  plot <- ggplot(data = data, mapping = aes(x = !!xaxis, y = !!yaxis)) +
    geom_point() +
    labs(title = title,
         subtitle = sub) +
    theme_minimal()

  return(plot)

}
Calling a Function:
When we execute the above code, it produces the following result:
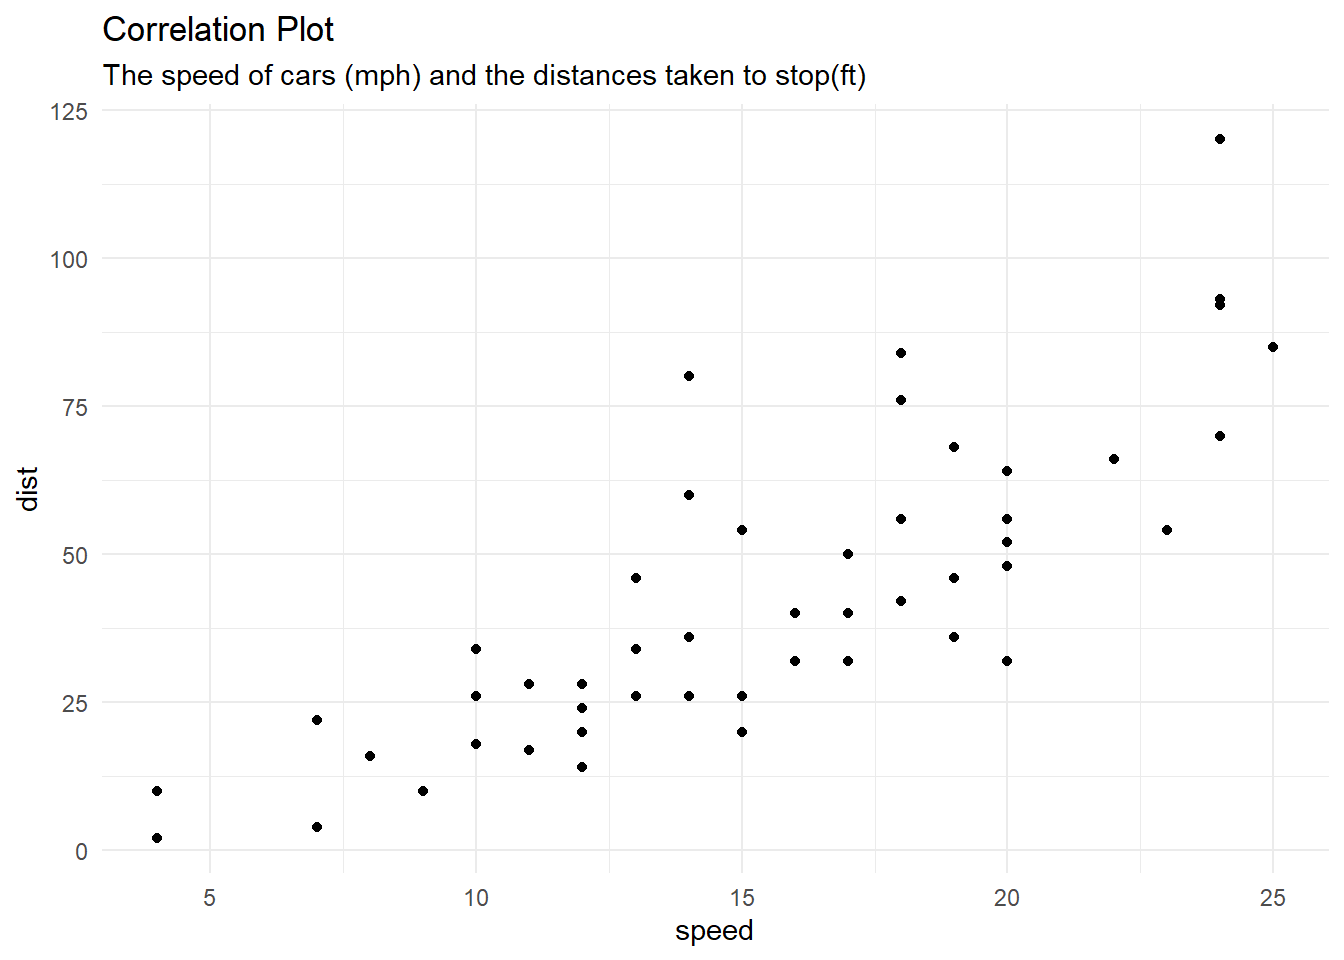
scatter_plot(
  data = cars,
  xaxis = "speed",
  yaxis = "dist",
  title = "Correlation Plot",
  sub = "The speed of cars (mph) and the distances taken to stop(ft)"
)
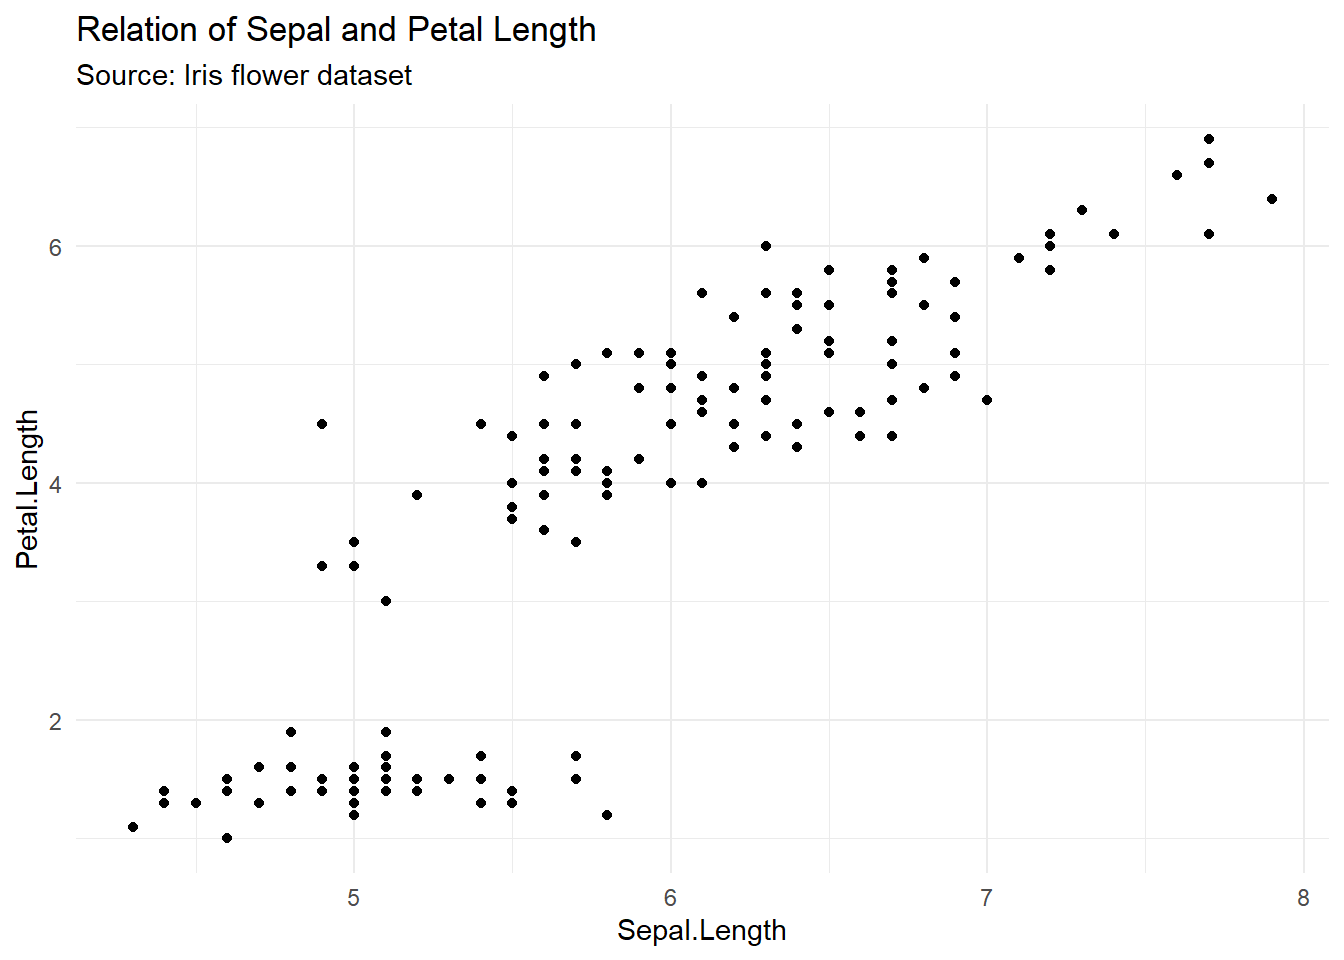
We can apply scatter_plot function to another data, see the following example:
scatter_plot(
  data = iris,
  xaxis = "Sepal.Length",
  yaxis = "Petal.Length",
  title = "Relation of Sepal and Petal Length",
  sub = "Source: Iris flower dataset"
)
Calling a Function without an Argument
new_scatter_plot <- function(){

  # define the library

  library(ggplot2)

  # visualization

  plot <- ggplot(data = cars, mapping = aes(x = speed, y = dist)) +
    geom_point() +
    labs(title = "Correlation Plot",
         subtitle = "The speed of cars (mph) and the distances taken to stop(ft)") +
    theme_minimal()

  return(plot)

}

new_scatter_plot()
Limitations if we do not define an argument, the function will be static according to the commands in function body. So, we need to add an argument if we want to create a dynamic function that can adjust the result with user-input.
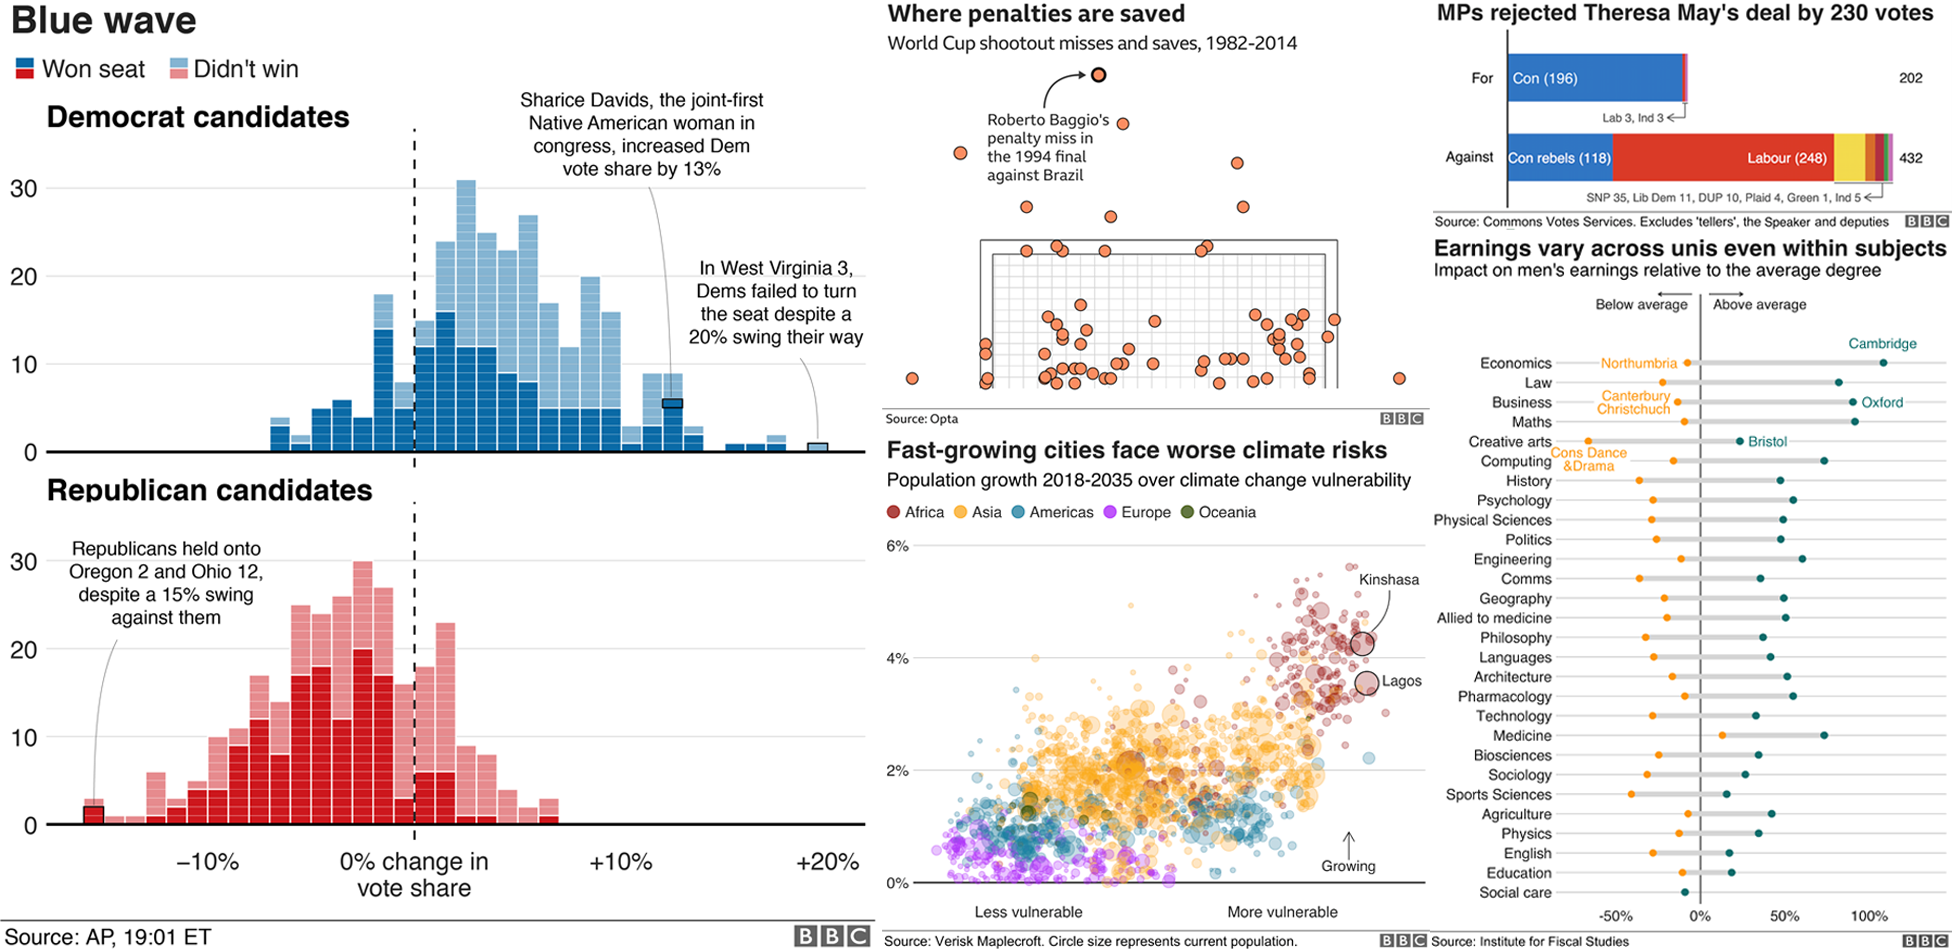
The BBC data team, developed an R package to make the process of creating publication-ready graphics in their style-guide using R’s ggplot2 library a more reproducible process, as well as making it easier for people new to R to create graphics:
All the custom function we made for this training purposes are stored in the helper.R file. You can dive deep to understanding the concept of function in R.
5.2 Intro to Shiny
Shiny is an open package from RStudio, which provides a web application framework to create interactive web applications (visualization) called “Shiny apps”. The ease of working with Shiny has what popularized it among R users. These web applications seamlessly display R objects (like plots, tables etc.) and can also be made live to allow access to anyone.
Shiny provides automatic reactive binding between inputs and outputs. It also provides extensive pre-built widgets which make it possible to build elegant and powerful applications with minimal effort.
5.2.1 Structure of a basic shiny apps:
- ui.R: User Interface (UI) for displaying input and output. This source code, is used to set-up what user will actually see in the web app, i.e. the layout of the web page, title, slider, widgets, plot, etc.
- server.R: For processing user’s input and render it into output
Everything that the user sees goes under UI.R, and everything that user does not see goes under server.R
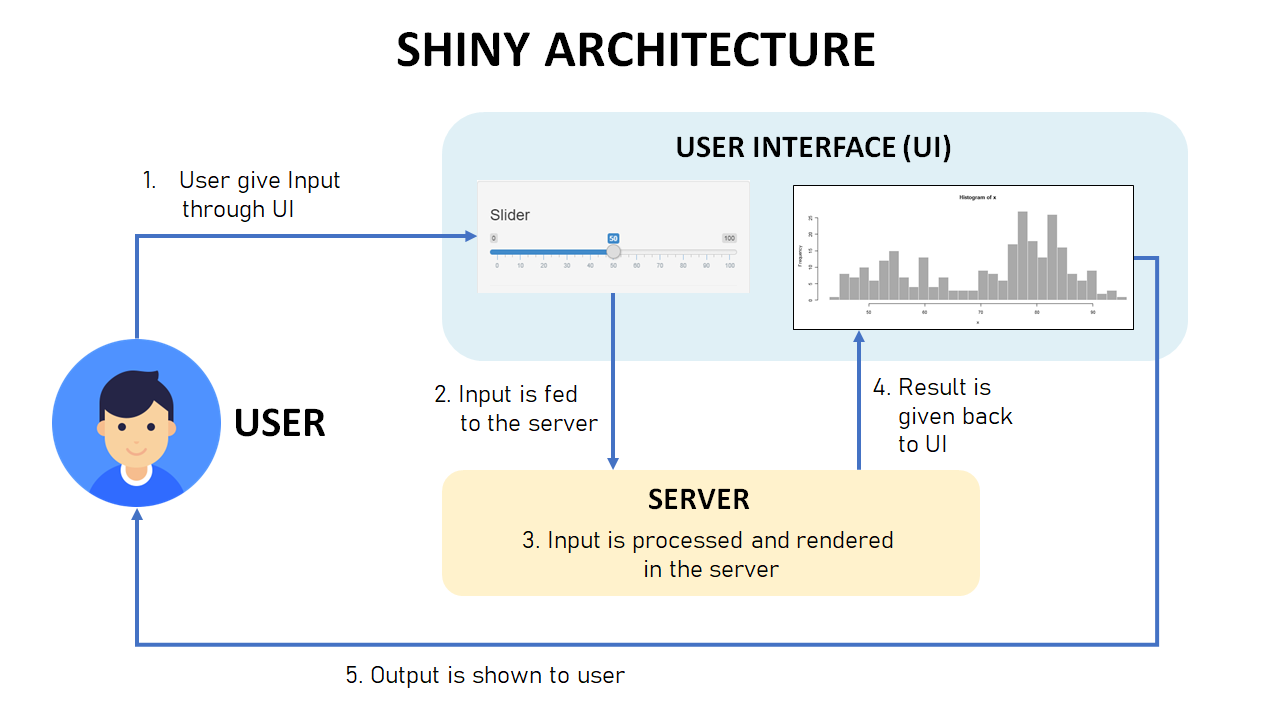
The following are the steps to describe image above:
- The user gives an input to the interface generated by UI.R
- The input is passed to server.R. This step does not need to be programmed. Shiny provided connectivity between the created interface and the R engine.
- The data is processed in server.R
- server.R return an output.
5.2.2 Advantages of Shiny
- Open Source:: Building and getting a shiny app online is free of cost, if you want to deploy your app on free version of shinyapps.io.
- Not required a technical skill: It requires no prior knowledge of HTML, CSS, or javascript to create a fully functional shiny app.
- Complete automation of the app: A shiny app can be automated to perform a set of operations to produce the desire output based on input.
5.2.3 Shiny app examples
Below is a some collection of Shiny examples. You can go to https://shiny.rstudio.com/gallery/ for more Shiny User showcases.
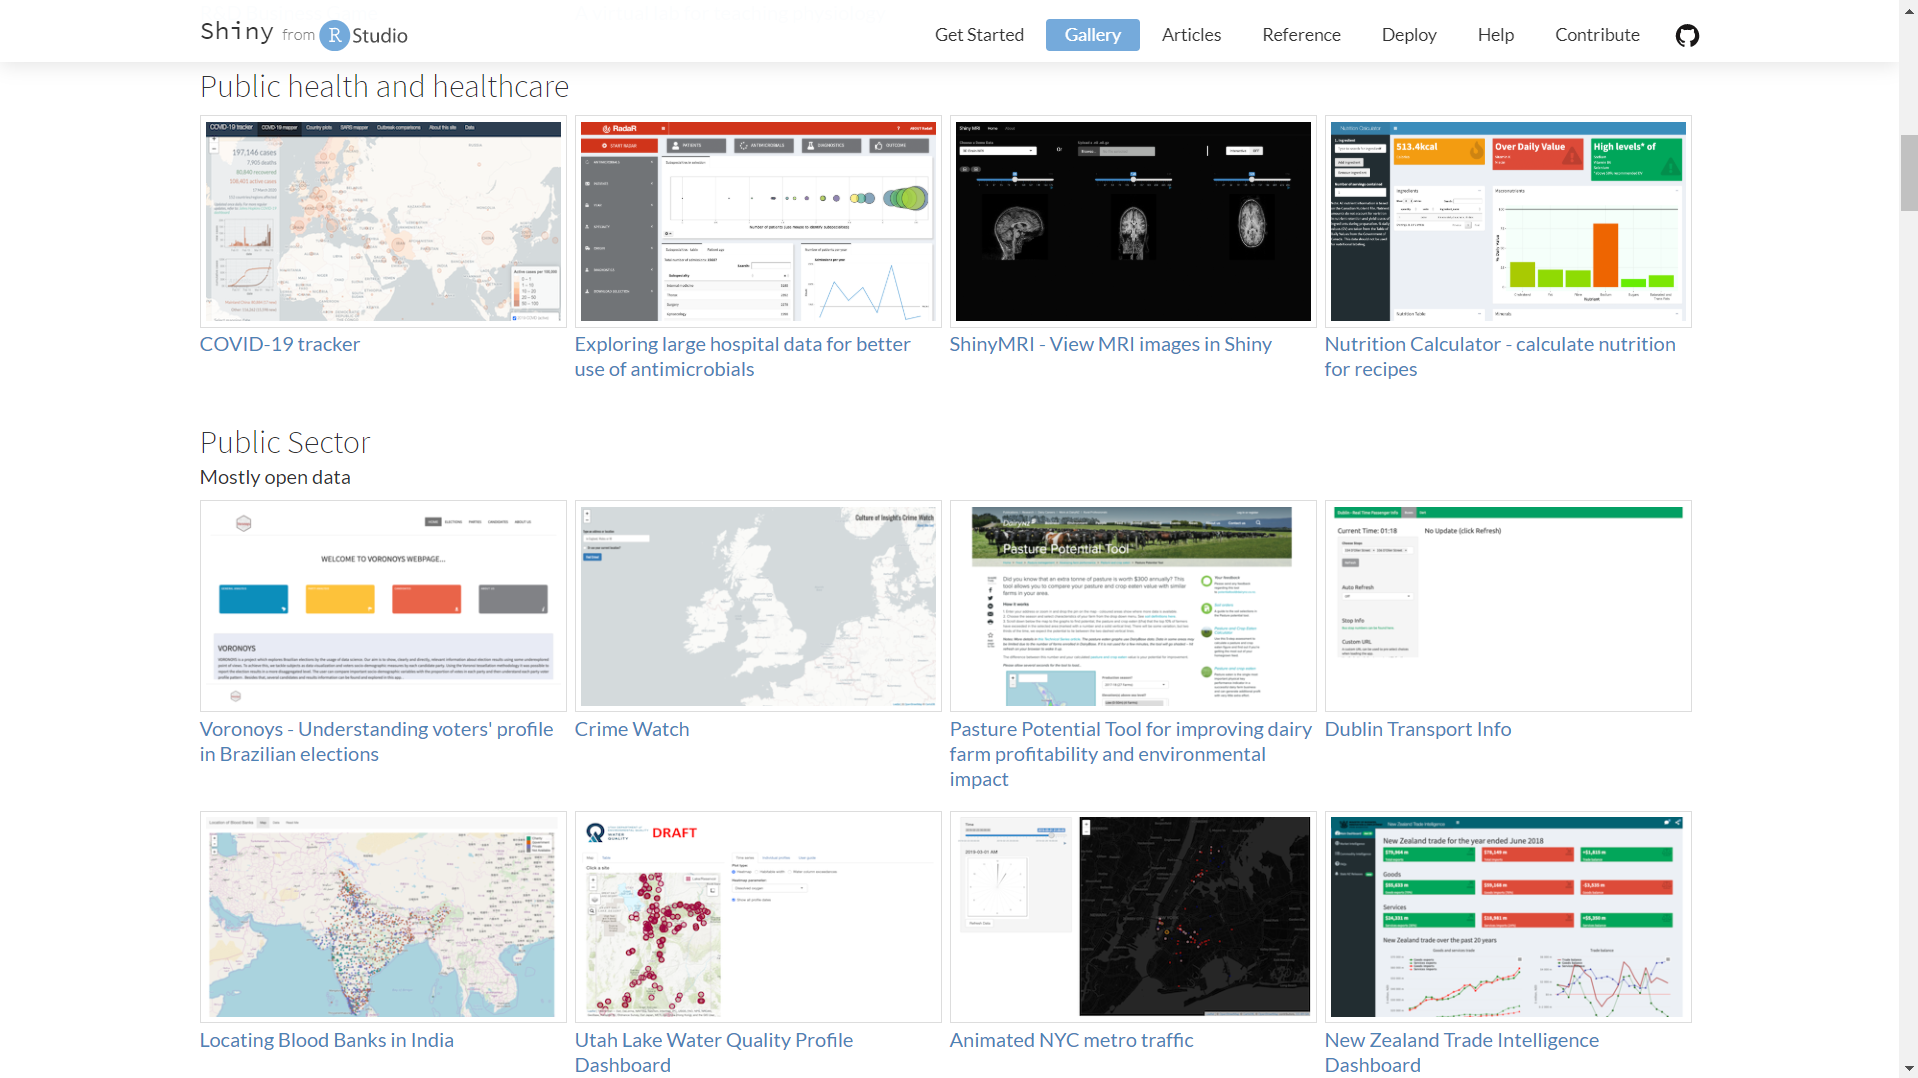
- Movie Explorer (https://shiny.rstudio.com/gallery/movie-explorer.html)
- Understanding voter’s profile in Brazilian election (https://voronoys.shinyapps.io/voronoys/)
- COVID-19 tracker (https://vac-lshtm.shinyapps.io/ncov_tracker/)
Our academy’s alumni also making a final project using shiny app to demonstrate their case study https://algorit.ma/our-alumni/.
- Sentiment Analysis of 5 American Airline brand on Twitter tweets (https://giselavaline.shinyapps.io/SentimentAnalysis/).
- Created a tools to assess power plant planning in Indonesia, based on electricity demand forecast and planned infrastucture (https://dody.shinyapps.io/powplan/)
- Predicting the movement in Indonesian stock market using machine learning (https://hyacinthrien54.shinyapps.io/Stock/).
5.3 Combining Shiny and Rmarkdown for generating reports
After interect with a Shiny application and getting a parameter as an input, your users may want to download a report in HTML, word, or PDF format. You can easily add the ability to generate report with knitr and rmarkdown at the click of a a button. The app takes one input value, and passes it as a parameter to an .Rmd document, which is rendered (or knitted) into an HTML output file.
- We first need a R markdown template that we can use for the report generation.
---
title: "Dynamic report"
output: html_document
params:
  n: NA
---

```{r}
# The `params` object is available in the document.
params$n
```

A plot of `params$n` random points.


```{r}
plot(rnorm(params$n), rnorm(params$n))
```- To generate report from shiny, we use
downloadHandlerand render the template we already created before usingrmarkdown::render. This function is called each time the user click the download button.
shinyApp(
 ui = fluidPage(
  sliderInput("slider", "Slider", 1, 100, 50),
  downloadButton("report", "Generate report")
 ),
 server = function(input, output) {
  output$report <- downloadHandler(

   filename = "report.html", ###### 1
   content = function(file) {

    tempReport <- file.path(tempdir(), "report.Rmd") ###### 2
    file.copy("report.Rmd", tempReport, overwrite = TRUE)


    params <- list(n = input$slider) ###### 3


    rmarkdown::render(tempReport, output_file = file, ###### 4
                      params = params,
                      envir = new.env(parent = globalenv())
    )
   }
  )
 }
)
This app takes one input value, and passes it as a parameter to an .Rmd document, which is rendered (or knitted) into an HTML output file. The following is a detailed description of each command line (See the number marker):
- For PDF output, change this to report.pdf.
- Copy the report file to a temporary directory before processing it, in case we don’t have write permissions to the current working dir (which can happen when deployed).
- Set up parameters to pass to Rmd document.
- Knit the document, passing in the
paramslist, and eval it in a child of the global environment (this isolates the code in the document from the code in this app).